Regression using sci-kit learn#
from sklearn.datasets import make_regression
from sklearn.preprocessing import scale
import matplotlib.pyplot as plt
from sklearn.model_selection import train_test_split
from sklearn.linear_model import LinearRegression
from sklearn.metrics import mean_squared_error
import pandas as pd
%matplotlib inline
Make some fake regression data#
We make some data with 5 features, but 3 ones that will help us predict. We made one of the features redundant with another by replicating an existing feature and scaling it. We are going to follow our process here:
Build model
Fit data
Evaluate fit
Visualize
But we can probably appreciate that we should look at these data before we try to do our analysis.
# generating data
X, y = make_regression(n_samples=100, n_features=5, n_informative=3, n_targets=1, noise=0.2, random_state=42)
X[:, 1] = X[:, 0] * 100 # Make a variable redundant and scale it poorly so you can see it

#Convert to pandas data frame
df = pd.DataFrame(X, columns=['Feature 1', 'Feature 2', 'Feature 3', 'Feature 4', 'Feature 5'])
df['Target'] = y

df.head()
| Feature 1 | Feature 2 | Feature 3 | Feature 4 | Feature 5 | Target | |
|---|---|---|---|---|---|---|
| 0 | -1.867265 | -186.726519 | -1.612716 | 2.314659 | -0.471932 | 67.011794 |
| 1 | -0.493001 | -49.300093 | 0.849602 | -0.208122 | 0.357015 | -63.011106 |
| 2 | -0.059525 | -5.952536 | -1.024388 | -0.926930 | -0.252568 | -178.808987 |
| 3 | -1.124642 | -112.464209 | 1.277677 | 0.711615 | 0.332314 | -72.663818 |
| 4 | -0.465730 | -46.572975 | -1.913280 | -0.463418 | -1.724918 | -47.971879 |
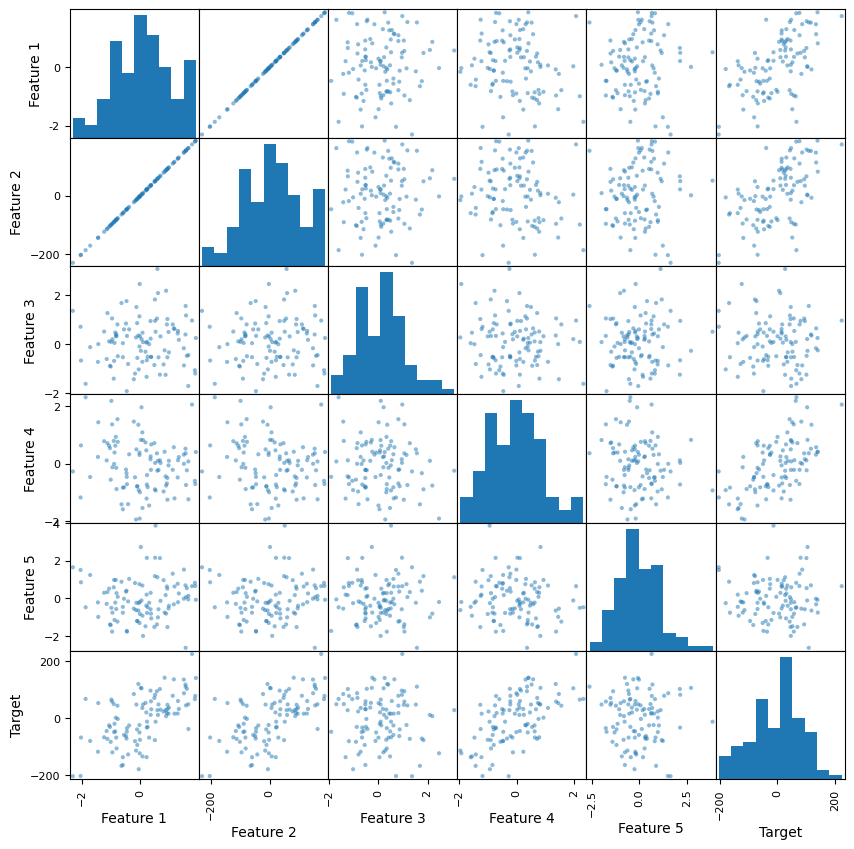
Creating subplots#
These are the “feature subspaces” we discussed. This plot also illustrates one reason for using pandas. Its exploratory data analysis tools are really simple to invoke.
pd.plotting.scatter_matrix(df, figsize=(10,10));
Linear Regression#
We will instead use the machine learning paradigm for our linear regression. Below, we have split the data for you. Your job is to perform the linear regression – building the model on the test data, and validate against the true data.
# split dataset into train and test sets
X_train, X_test, y_train, y_test = train_test_split(df.drop('Target', axis=1), df['Target'], test_size=0.2, random_state=42)