
Making a Poincare Section#
Contributed by Mihir Naik; updated by Caballero#
import numpy as np
import matplotlib.pyplot as plt
from scipy.integrate import odeint
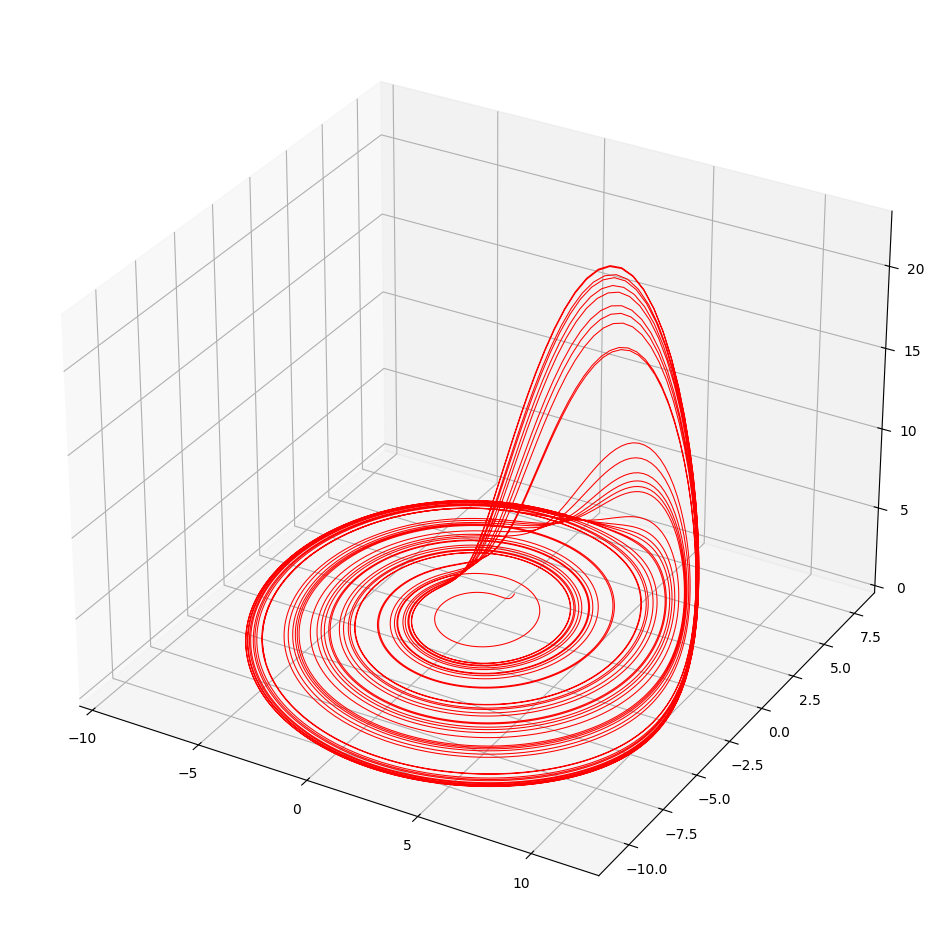
def rossler_system(state, t, a, b, c):
    x, y, z = state
    dxdt = -y - z
    dydt = x + a * y
    dzdt = b + z * (x - c)
    return [dxdt, dydt, dzdt]
state0 = [1.0, 1.0, 1.0]

a, b, c = 0.2, 0.2, 5.7


t = np.linspace(0, 250, 10000)

sol = odeint(rossler_system, state0, t, args=(a, b, c))

# 5. Extract results
x, y, z = sol[:, 0], sol[:, 1], sol[:, 2]

fig = plt.figure(figsize=(12, 12))
ax = fig.add_subplot(111, projection='3d')
ax.plot(x, y, z, lw=0.75, color='red')
plt.show()
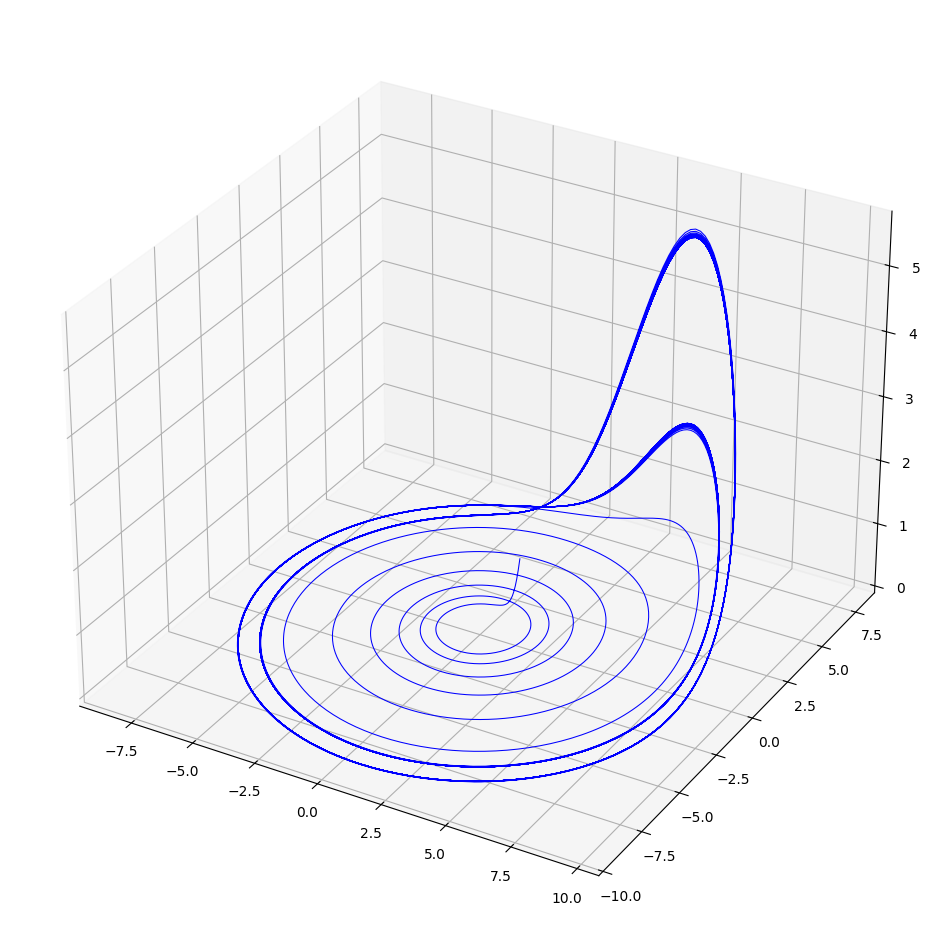
state0 = [1.0, 1.0, 1.0]

a, b, c = 0.1, 0.1, 5.6

t = np.linspace(0, 250, 10000)

sol2 = odeint(rossler_system, state0, t, args=(a, b, c))

# 5. Extract results
x2, y2, z2 = sol2[:, 0], sol2[:, 1], sol2[:, 2]

fig2 = plt.figure(figsize=(12, 12))
ax2 = fig2.add_subplot(111, projection='3d')
ax2.plot(x2, y2, z2, lw=0.75, color='blue')
plt.show()
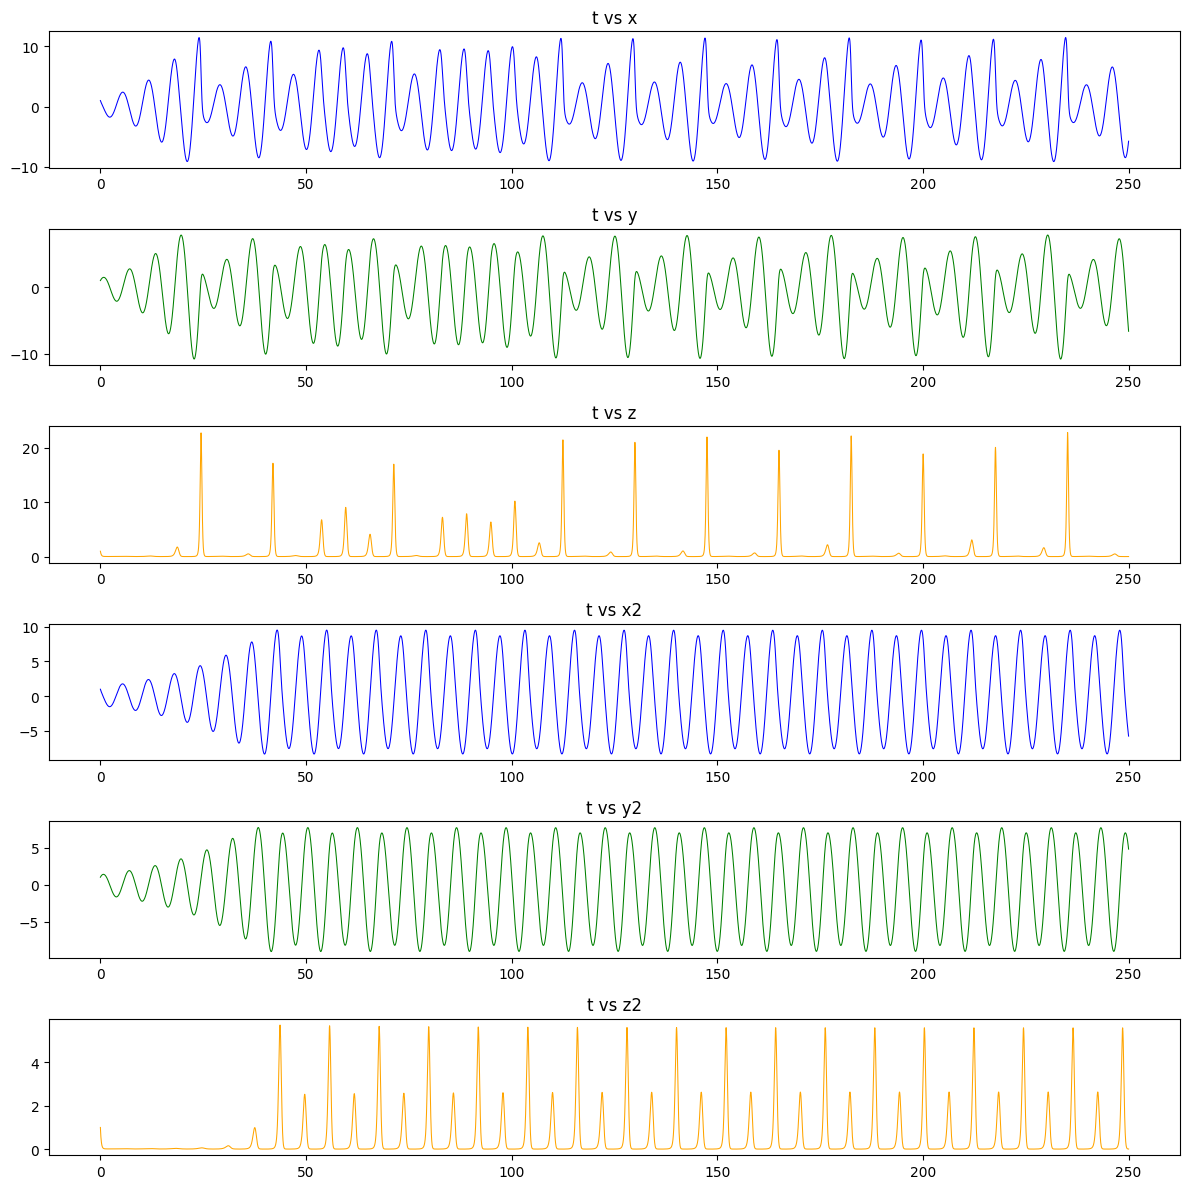
# plot t vs x, t vs y, t vs z
fig, axs = plt.subplots(6, 1, figsize=(12, 12))
axs[0].plot(t, x, lw=0.75, color='blue')
axs[0].set_title('t vs x')
axs[1].plot(t, y, lw=0.75, color='green')
axs[1].set_title('t vs y')
axs[2].plot(t, z, lw=0.75, color='orange')
axs[2].set_title('t vs z')
axs[3].plot(t, x2, lw=0.75, color='blue')
axs[3].set_title('t vs x2')
axs[4].plot(t, y2, lw=0.75, color='green')
axs[4].set_title('t vs y2')
axs[5].plot(t, z2, lw=0.75, color='orange')
axs[5].set_title('t vs z2')
plt.tight_layout()
plt.show()
# poincare section at z = 0.5
z_section = 0.5
crossings = []
for i in range(1, len(z)):
    if (z[i-1] < z_section and z[i] >= z_section) or (z[i-1] >= z_section and z[i] < z_section):
        crossings.append((x[i], y[i]))
crossings = np.array(crossings)
plt.figure(figsize=(8, 6))
plt.scatter(crossings[:, 0], crossings[:, 1], color='blue')
plt.title('Poincaré Section at z = 0.5')
plt.xlabel('x')
plt.ylabel('y')
plt.grid()
plt.show()
print(f'There are {len(crossings)} crossings')
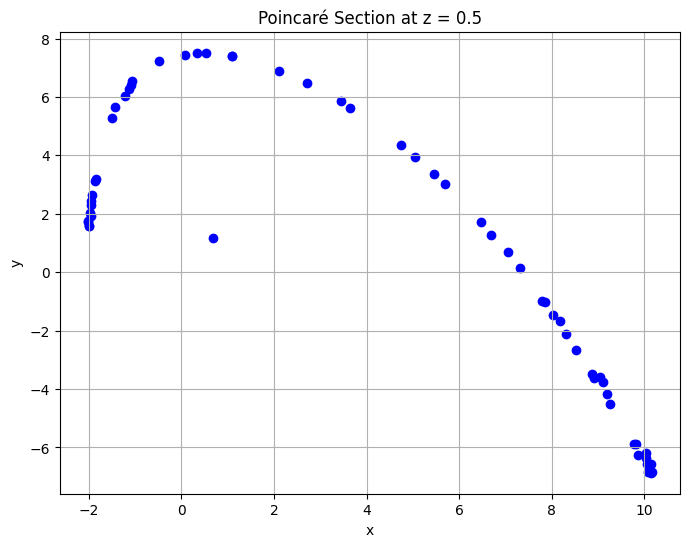
There are 59 crossings
# poincare section at z2 = 0.5
z_section = 0.5
crossings = []
for i in range(1, len(z2)):
    if (z2[i-1] < z_section and z2[i] >= z_section) or (z2[i-1] >= z_section and z2[i] < z_section):
        crossings.append((x2[i], y2[i]))
crossings = np.array(crossings)
plt.figure(figsize=(12,12))
plt.scatter(crossings[:, 0], crossings[:, 1], color='red')
plt.title('Poincaré Section at z2 = 0.5')
plt.xlabel('x2')
plt.ylabel('y2')
plt.grid()
plt.show()
print(f'There are {len(crossings)} crossings')
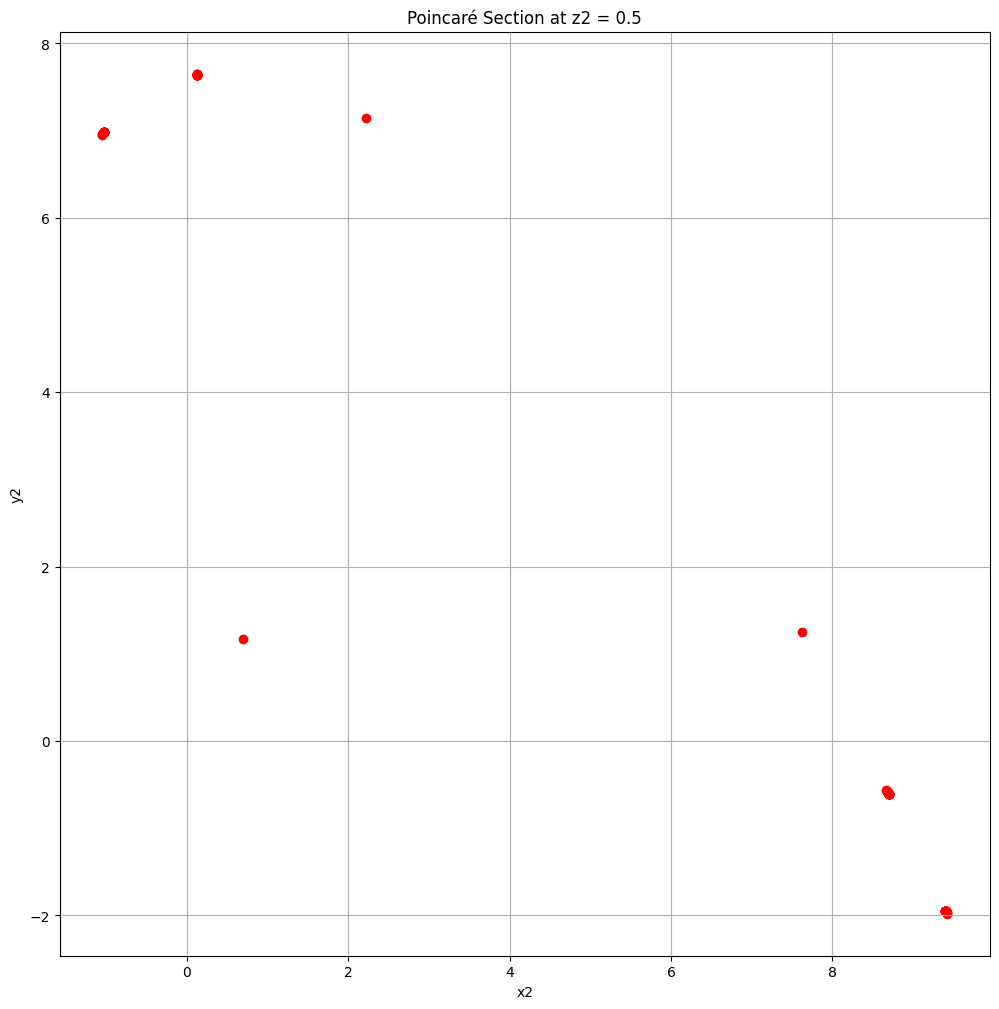
There are 73 crossings