
Administrative
- Midterm will be given Thursday 10/29 in class
- Focus on classification problems (More details on Tuesday; review sheet)
- Read data, clean data, filter data, standardize data, model data, evaluate model with plots
- Open book, note, internet - no chatting with other students
- Changing groups: After the midterm we will put you in new groups for the rest of the semester.
- We will try to keep you with at least one other person from your current group.
- Please complete this MidSemester survey: www.egr.msu.edu/mid-semester-evaluation
Reminder of the ML Paradigm
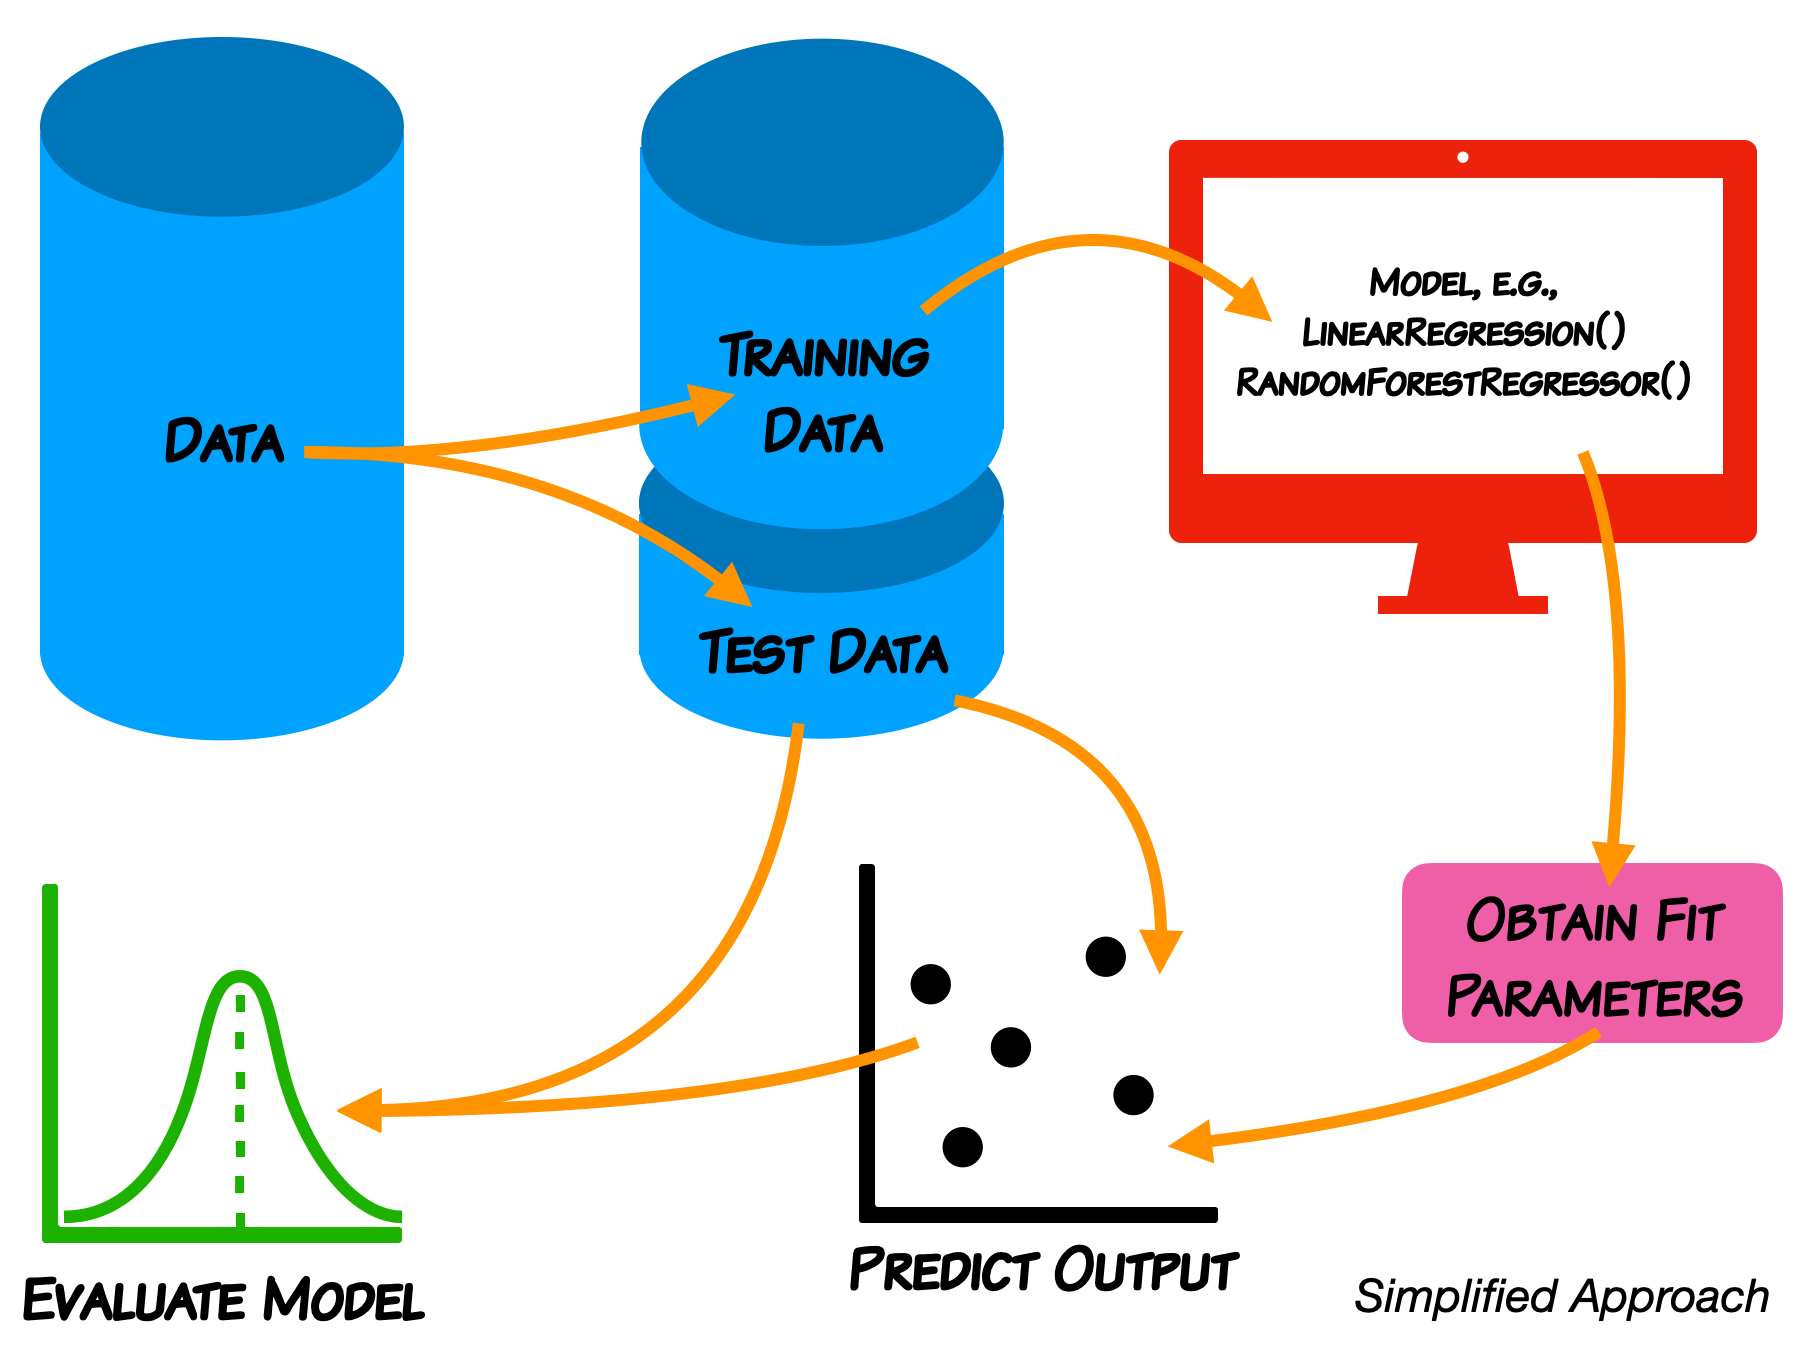
We do not expect you in this class to learn every detail of the models.
Support Vector Machines
- As a classifier, an SVM creates new dimensions from the original data, to be able to seperate the groups along the original features as well as any created dimensions.
- The kernel that we choose tells us what constructed dimensions are available to us.
- We will start with a linear kernel, which tries to construct hyper-planes to seperate the data.
- For 2D, linearly separable data, this is just a line.
We use make_blobs because it gives us control over the data and it's separation; we don't have to clean or standardize it.
Let's make some blobs
In [19]:
##imports
import numpy as np
import matplotlib.pyplot as plt
from sklearn import svm
from sklearn.datasets import make_blobs

X, y = make_blobs(n_samples = 100, n_features=2, centers=2, random_state=3)

## Plot Blobs
plt.scatter(X[:,0], X[:,1], c=y, cmap="viridis")
plt.xlabel(r'$x_0$'); plt.ylabel(r'$x_1$')
Out[19]:

Let's draw a separation line
We are just guessing. SVM does this automatically.
In [23]:
## Make guess for separation line
plt.scatter(X[:,0], X[:,1], c=y, cmap="viridis")

xx = np.linspace(-6.5, 2.5)

#yy = -1*xx
#yy = -2 * xx - 1
yy = -0.5 * xx + 1
plt.plot(xx,yy)
Out[23]:
