Administrative
- Homework 3 will be assigned Friday 10/9 and due Friday 10/23
- Midterm will be given Thursday 10/29 in class
- Please complete this MidSemester survey: www.egr.msu.edu/mid-semester-evaluation
From Pre-Class Assignment
Useful Stuff
- Videos were useful, but they were a little long
- I have a better idea of how we are evaluating classification models
Challenging bits
- There's so much terminology, do I have to remember it all?
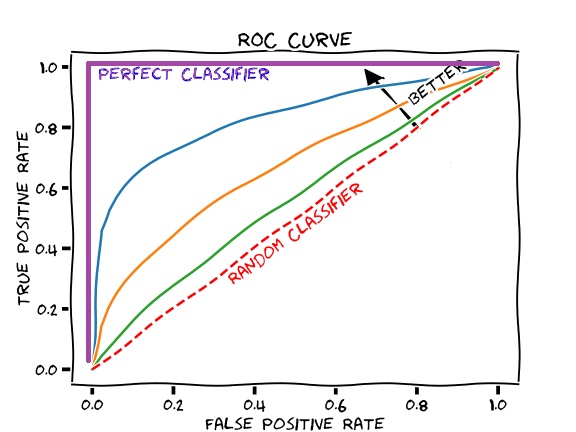
- I'm still confused about the ROC and what it is doing.
- How is KNN a binary classifier?
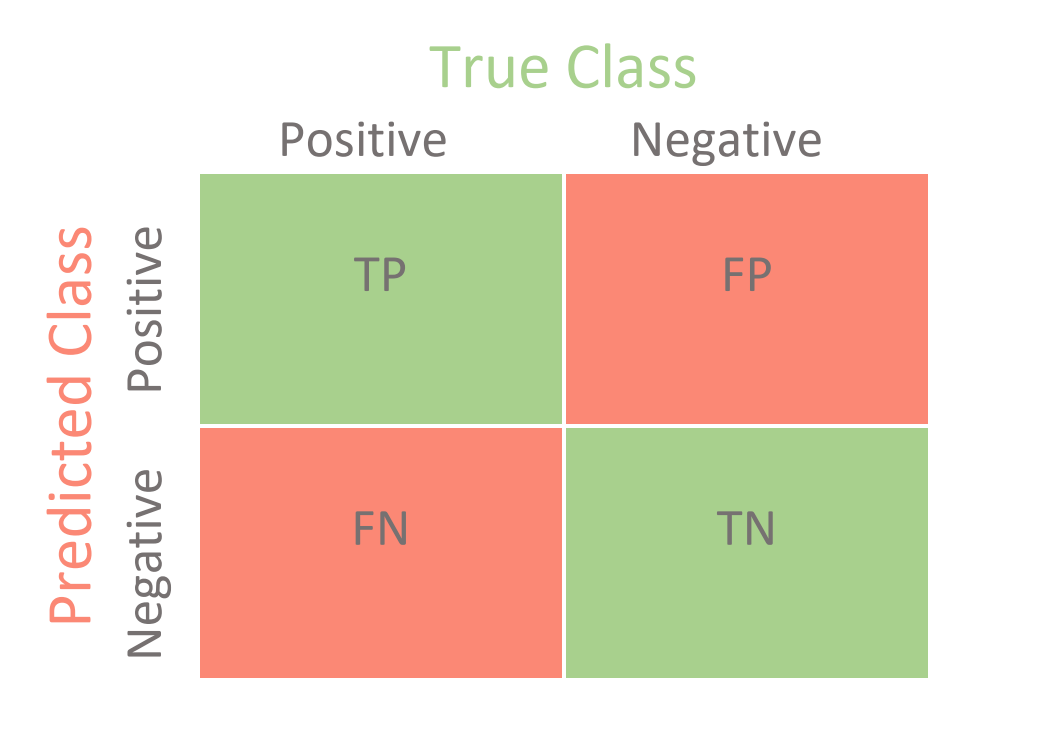
The Confusion Matrix

from sklearn.metrics import confusion_matrix
tn, fp, fn, tp = confusion_matrix(y_true, y_predicted)
Note the rows and columns of the confusion matrix from sklearn do not match those show on most websites.
Other Metrics
- Sensitivity (Recall): The ratio of True Positives to all Positive Cases $\dfrac{TP}{TP+FN}$
- Specificity: The ratio of True Negatives to all Negative Cases $\dfrac{TN}{TN+FP}$
Precision: The ratio of True Positives to all Predicted Positives: $\dfrac{TP}{TP+FP}$
$F_1$ Score: A balanced measure (0 to 1) that includes sensitity and recall: $\dfrac{2 TP}{2TP + FP + FN}$
ROC Curve and AUC

from sklearn import metrics
fpr, tpr, thresholds = metrics.roc_curve(y_true, y_predict)
roc_auc = metrics.auc(fpr, tpr)
plt.plot(fpr, tpr)
KNN as a Binary Classifier

A Heads Up for Today
Working with Pima Diabetes Database, which has problems (zeros for various entries). We have given you a cleaned data set on D2L (you will need to download it again!).
You can skip 2.1 and 2.2 today and go to 2.3; we will discuss how to clean that data after class.
